Family & Parenting
ATAR Scaling by the Numbers: Rank Beats Scaling, Except in the Top Maths Courses


Somewhere in Year 10 or Year 11, most students hear that the subjects they pick now will quietly raise or sink their ATAR, and that some choices are traps. The official numbers tell a calmer story. Scaling adjusts for the strength of the students who sit a course, not for how hard its content is, so the scaled mark a student ends up with depends mostly on where they rank inside that course. Our position follows the two admissions centres that run the calculation: choose subjects on ability, interest and prerequisites. There is one real exception, and the 2025 tables show it clearly. Students who genuinely belong in the top maths courses do gain from them.
What scaling is, in two systems
The mechanics differ by state, and only two sets of figures appear in this article.
In New South Wales, the Universities Admissions Centre (UAC) builds the ATAR from a student’s best 10 units, which must include two units of English, and each unit carries a scaled mark out of 50. UAC notes that for most courses the scaled mark will be lower than the HSC mark, and that scaled marks are not reported to students at all, which is why so many students compare the wrong numbers when results arrive. In Victoria, the Victorian Tertiary Admissions Centre (VTAC) converts each study score to a scaled score between 0 and 55, then adds the top four scaled scores, one of which must be an English, to 10 per cent of the fifth and sixth. Queensland, South Australia, Western Australia and the ACT run their own calculations through QTAC, SATAC, TISC and BSSS, and their own publications are the place to look.
The common thread is that the ATAR is a rank, not a score. A rank behaves differently from a fixed line. A threshold like the 75 per cent pass mark on the Australian citizenship test can be cleared by every candidate in the room at once; an ATAR places each student relative to everyone else in their age group, so it cannot be earned by choosing a subject with a reputation. It is earned by placing well.
The check: when a predicted mark comes back from school, ask whether it is an HSC mark, a study score or a scaled figure, because the three are not interchangeable.
Why your rank sets the scaled mark
UAC puts the principle in a single sentence: “Your scaled mark in a course will be influenced by your position in the course and the scaled mean for that course.” Both parts matter, and the second is the one that gets all the attention. The first is the one a student controls.
The table below is drawn from UAC’s Table A3 for the 2025 HSC. Each figure is a scaled mark on a 1-unit basis, out of 50. P90 is the scaled mark of a student who placed ahead of 90 per cent of that course’s candidates; P50 is the middle of the course; P25 is a quarter of the way up.
| NSW course, 2025 HSC | Students | Scaled mean | P90 | P50 | P25 |
|---|---|---|---|---|---|
| English Standard | 33,651 | 20.4 | 31.5 | 20.0 | 14.5 |
| English Advanced | 26,292 | 32.8 | 42.6 | 33.7 | 27.7 |
| Mathematics Standard 2 | 31,762 | 23.3 | 37.3 | 23.2 | 15.1 |
| Mathematics Advanced | 16,809 | 31.9 | 42.9 | 33.2 | 25.9 |
| Mathematics Extension 1 | 9,279 | 39.7 | 47.2 | 41.5 | 36.6 |
| Mathematics Extension 2 | 3,844 | 43.4 | 48.3 | 44.7 | 41.5 |
| Business Studies | 20,452 | 23.9 | 39.2 | 23.4 | 15.1 |
| Biology | 20,710 | 26.2 | 39.9 | 26.7 | 18.0 |
| Chemistry | 10,369 | 32.0 | 43.6 | 33.9 | 25.8 |
| Physics | 8,817 | 31.0 | 43.0 | 32.2 | 24.0 |
| Legal Studies | 10,080 | 25.3 | 39.9 | 25.9 | 16.5 |
| Economics | 5,741 | 31.4 | 43.0 | 33.0 | 25.0 |
Read across any row and the spread inside a course is wider than the gap between most courses. Business Studies runs from 15.1 at P25 to 39.2 at P90, a range of more than 24 marks, while the difference between its scaled mean and Biology’s is 2.3.
Two limits apply to this table, and UAC states the first itself. Table A3 “should not be used as a simple HSC to scaled mark conversion table”; its primary purpose, in UAC’s words, “is to show the relativities between courses.” The second is that these are 2025 figures, produced by the 2025 cohort, and no table published today can say where a student sitting the HSC in 2027 will land.
The check: find each subject on a shortlist in the table and note how far apart its P50 and P90 sit. That gap is the reward for ranking well, and it is usually larger than any reputation the subject carries.
Three worked examples from the 2025 tables
The students below are hypothetical, invented for illustration. The figures are from the official 2025 tables.
Student A, NSW. Say Student A could realistically finish near the 90th percentile in Business Studies but would sit around the middle of Mathematics Advanced. In Business Studies the P90 scaled mark was 39.2; in Mathematics Advanced the P50 was 33.2. Playing to strength is worth 6.0 scaled marks per unit, and if a middling rank in Advanced slipped to the 25th percentile (25.9), the gap widens to 13.3 per unit. Both are 2-unit courses, so the difference counts twice in the aggregate. On these numbers the “low-scaling” choice is the stronger one for this student, because rank outweighs reputation.
Student B, Victoria. The VTAC 2025 report shows a study score of 40 in Business Management scaling to about 38, and a study score of 25 in Specialist Mathematics scaling to about 36. A strong result in the course with the lower mean beats a weak result in the course with the highest mean among the maths studies. Specialist does pay when the result is respectable: 30 in Specialist scaled to about 43, within a mark of 45 in General Mathematics, which scaled to about 44. The rough break-even on these figures is that Specialist pays off only if a student would land within about 15 study-score points of their General Mathematics result. VTAC publishes these figures as rounded integers and describes them as “an indication” of how scaling adjusts scores, so they are a guide, not an exact conversion.
The ceiling. The highest scaled mark awarded in Mathematics Standard 2 in 2025 was 47.1, and the P99 was 42.9. In English Standard the maximum was 49.3. Scaling reflects how the whole cohort performed, and in these courses even the top result scaled below 50. That is a limit worth knowing, and it cuts both ways. A student at the 90th percentile in Standard 2 scaled to 37.3, below the Mathematics Advanced P75 of 38.9 but well above the Advanced P50 of 33.2 and the P25 of 25.9. For a student who would rank in the bottom half of Advanced, a strong Standard 2 result is usually the better trade.
The check: run your own version of Student A. Pick two candidate subjects, estimate honestly where you would rank in each, and read the scaled marks at those two positions rather than the two means.
Where scaling does count: the top maths courses
The exception is real.
In the 2025 NSW table, a student at the 25th percentile of Mathematics Extension 2 had a scaled mark of 41.5, which is 2.6 marks above a student at the 75th percentile of Mathematics Advanced (38.9). The Extension 1 median was 41.5, and the Extension 2 median of 44.7 sat above the P90 of every course in the table outside the two extensions. In Victoria, Specialist Mathematics had the highest mean of the maths studies at 41.5, and a study score of 40 scaled to about 51, which is where the shorthand that “spesh scales above 50” comes from.
The reason is the cohort. Scaling responds to how well the students in a course perform across all their other courses, and the students who take the top maths courses tend to be strong across the board. UAC’s Table 4.6 shows how concentrated that strength is: among students with an ATAR between 99.00 and 99.95, 67 per cent had an E4, the top band, in Mathematics Extension 2 counting towards their ATAR, and 86 per cent had an E4 in Extension 1.
A vocal minority of students online argue that scaling matters a great deal at the top, and on this point the tables support them. The condition is the one that gets left out of that argument. The gain goes to students who belong in the course, who can keep up with the content and still finish in the middle of a very strong group. A student who is struggling in Extension 2 and would rank near the bottom is the case the “trap” warning describes, and that student usually does better consolidating Extension 1 or Advanced and ranking well there.
The check: ask the maths teacher one direct question, which is where you would be likely to rank in the extension course, not whether you could pass it.
Scaling moves every year
Any published list of high and low scalers describes the cohort that has already sat the exams. VTAC states that “VCE studies are always scaled in the year in which you undertook them”, and UAC recalculates scaling for every HSC cohort in the same way.
The movements are usually small. Between the VTAC 2024 and 2025 reports, a study score of 40 in Specialist Mathematics went from about 52 to about 51, and a 40 in Physics went from about 43 to about 42. Neither change would reverse a sensible choice. They do show that a list consulted in Year 10 describes a group of students two or three years ahead, and nobody outside the admissions centres can know how a future cohort will perform.
The check: whatever list you are shown, look at the year printed on it, then open the current official report and compare.
Myth or strategy: where the advice splits
Two pieces of advice circulate, and they sound opposed. Schools, and the most common view among students online, hold that choosing for scaling is a trap and that a student should take what they enjoy. Tutoring lists rank subjects from best to worst scaling and imply that the order matters. Both are half right.
The ruling, on the 2025 tables: scaling never rescues a weak rank, and it does reward a strong one in a strong cohort. Student A shows the first half, where a top-10-per-cent result in a lower-scaling course beat a middling result in a higher one by 6 marks per unit. The Extension 2 figures show the second half, where even a modest rank in a very strong group scaled above a good rank elsewhere. Students who worry that their subjects “scale down” can take some reassurance from the first half, because a high rank in any course still produces a high scaled mark.
What decides it
UAC’s guidance is plain: “Do not choose courses on the basis of what you believe are the likely effects of scaling.” Choice, it says, should be determined by “your interests, your demonstrated abilities and the value of courses for your future career plans.” VTAC says much the same, warning that “choosing a study that you are not very good at, or engaged in, simply because it may be scaled up would be a mistake.”
That leaves three factors worth weighing side by side. Prerequisites and assumed knowledge come first, because a degree that requires a particular maths or science course will require it whatever that course scaled to last year, and university course pages list these for each degree. Rank comes second, meaning the subjects where a student is likely to finish well up the course, judged on results so far rather than hope. Interest comes third, and it is less soft than it sounds: two years of steady effort is easier in a subject a student wants to do, and that effort is what produces the rank.
What none of the tables can show is how a particular student will develop over Year 11 and 12. That is the limit of any cohort figure, and a reason to weight ability and interest, which a student and their teachers can judge, above a number set by students who have already left school.
The check: open the current scaling report for your state, look up the P50 and P90 for each subject on the shortlist, and set those figures beside the prerequisites for the degrees in view.
What to take into the subject selection meeting
Subject selection is one of the first big decisions a student makes with real numbers attached, and it rewards the same habit in student and parent alike, which is asking the next question rather than accepting the reputation. Three questions cover most of it.
- Where would I rank in this course? Ask teachers for an honest estimate based on results so far. Rank is the largest single influence on the scaled mark.
- Which courses are prerequisites or assumed knowledge for the degrees I am considering? These are fixed requirements, and they should be on the list before anything else.
- If this is a top maths course, do I belong there? If the answer is yes, the 2025 tables show it pays. If the answer is “only just”, the stronger move is usually the course where you would rank well.
A student who chooses on ability, interest and prerequisites is choosing the way UAC and VTAC recommend, and the 2025 figures show why that advice holds. Rank sets the scaled mark, and the top maths courses lift it for students who genuinely belong in them.
Sources: Report on the Scaling of the 2025 NSW Higher School Certificate, Universities Admissions Centre (https://uac.edu.au/assets/documents/scaling-reports/scaling-report-2025-nsw-hsc.pdf); 2025 Scaling Report, Victorian Tertiary Admissions Centre (https://vtac.edu.au/files/pdf/reports/scaling-report-25.pdf); ATAR and scaling guide, Victorian Tertiary Admissions Centre (https://vtac.edu.au/atar-scaling-guide-2025.html)

If you learned how the Child Care Subsidy works before this year, you learned it with the Activity Test in the middle of it, and that is the version most families still carry around in their heads. It is also no longer the version that runs the show. From January 2026, the Activity Test was replaced by the 3 Day Guarantee, and the change matters even if you think nothing has moved for your family.
If you are reading this with a statement open on one screen and a centre’s fee schedule on the other, you are not alone in that, and you are doing the right thing. Families often read more than one set of rules at once, and the site’s piece on medium-term accommodation for families exists for the same reason this one does: to make a support scheme legible without the guesswork.
If that is you, nothing is wrong with your memory either. Policies that change in January take about a year to change in kitchens and car parks, and the version in your head is the version the old forms asked about. This article is the updated version, in the order a family needs it: the hours first, then the money, then the number on your own statement.
And if your child’s hours are already where you want them, the change may not move your family at all. That is the point of a floor: it matters most to the families underneath it, and it costs nothing to the families above.
The name is also the promise: three days. For a family weighing a fourth day of care, the guarantee’s arithmetic is the place to start, because the first three days carry the floor and everything above it is a question of activity, exemption and the family’s own budget.
What the guarantee says
The core of it is simple enough to hold in one sentence. From January 2026, all families are eligible for at least 72 hours of subsidised early childhood education and care per fortnight, which is three days per week, regardless of their activity levels. The word to sit with is “all”. You no longer qualify for those hours by counting your work, study or volunteering; they are the floor for every family.
The 100-hour tier still exists, and it is where two groups sit. Families can still get 100 hours of subsidised care per fortnight if they meet activity requirements or hold a valid exemption. And families caring for a First Nations child are eligible for 100 hours of subsidised care per fortnight, without the activity step. If your family is in either group, the guarantee did not reduce what you had; it lifted the floor underneath everyone else.
One clarification on what the hours are. The unit is hours of subsidised early childhood education and care, which is the same unit your provider counts when it records attendance. The 72 hours works out to three full days for a child who attends full days, and for a family using shorter sessions, the hours figure is the one to compare rather than the day count.

For a family already at 100 hours, the guarantee is neither a cut nor a windfall, because the entitlement sits where it sat. The change is easiest to understand as a floor moving rather than a ceiling shifting.
The guarantee also settles something that used to depend on paperwork arriving in advance. The hours are no longer conditioned on the activity figure a family reported, so the uncertainty that came with a change in work or study has less to land on. That is the design change in one line: the floor is unconditional, and the tiers above it remain for the families who meet the requirements.
The worked example, in the source’s own numbers
The fact sheet walks one family through the change, and it is best followed with their figures rather than a made-up family. Sarah and Alex have one child in care three days a week, which is 36 hours, and a combined income of $90,000. Under the old settings, their child was subsidised for 18 hours a week. From January 2026, they are eligible for 36 hours a week, which is the 72 hours a fortnight the guarantee describes.
At the average Centre-Based Day Care hourly fee, the fact sheet puts the difference at $230 a week, or $11,400 a year. That is the shape of the change for one family, and the fact sheet’s own table shows how it narrows as income rises.
| Combined income | Better off per week |
|---|---|
| $90,000 | $230 |
| $120,000 | $220 |
| $140,000 | $200 |
Read the table for what it is. These are weekly amounts at the average Centre-Based Day Care hourly fee, across 50 weeks of care, rounded, and they are illustrations of the change rather than a quote for any particular family. Your fee is your centre’s fee, and your hours are your child’s hours.
Two things stand out in those rows. The first is that the change narrows as income rises, which is the pattern the fact sheet is illustrating rather than a rule about any household. The second is that Sarah and Alex’s example turns on their hours, not on their income alone: a family on the same income with different booked hours lands somewhere else entirely. If your family’s shape is different, hold on to the direction of the change rather than the size of the example: the guarantee came in, and the ceiling stayed.
The annual figure belongs in a budget, because a weekly saving tends to disappear into the week. The fact sheet’s own annual figure for the worked example is $11,400, and that is the size of the change over a year.
What did not change
Here is the doubt to answer plainly, because it is the one most families arrive with: no, everything is not different now. The guarantee lifted the floor. It did not remove the ceiling.
The ceiling is still there in the form of the upper income edge. Families earning over $533,280 in 2024-25 are not eligible for subsidised care, on the fact sheet’s own dating of that figure. The dating is part of how the line should be read: it is the figure that applied in that year, which is why the statement, rather than a remembered threshold, is the thing to check. And hours are still the unit that matters most for planning a week: how many subsidised hours your child has, against how many hours your centre charges for, is the comparison that decides what you pay.
Household income is the number this scheme reads, and it is the number most likely to move during a year: a new job, a return to study or a change in hours all shift it. That is why the statement deserves a re-read whenever the household’s circumstances change, and not only when something looks wrong.
What did not change also deserves saying in the positive, because the guarantee built on the old system rather than replacing it. The activity-based 100-hour tier still sits at the top of the scale, exemptions still work as they worked, and the scheme’s basic shape, hours against fees, is intact. The guarantee changed the floor under every family, and it left the structure above the floor where it was.
For a family planning a year of care, the practical reading is straightforward. The subsidised hours on the statement are the planning unit: hours of subsidy per week, multiplied by the weeks of care the family uses, is the coverage a family has. Everything about the money flows from that number.
What it costs the country
One paragraph of context, because it is context rather than the story: the guarantee is costed at $426.7 million over five years from 2024-25, and that figure includes the implementation work for Services Australia.
The reason to know it is simple. A change with a budget line behind it is a change that has been built into a system, and systems are where your own hours and your own fees actually live. The figure also includes the implementation work for Services Australia, which is the part a family meets directly, because the systems that count hours and produce statements had to change along with the policy. One line closes the money section, and it matters: the guarantee is an entitlement of hours rather than a payment. What those hours are worth depends on the centre’s fee, which is why the fact sheet’s dollar figures are illustrations rather than promises.
Why your own statement is the real answer
This is the boundary of the article: no page can tell your family its rate. The figures above are the fact sheet’s examples, and your entitlement depends on your income, your child’s hours and your centre’s fees, which are not visible from here.
The two statements are where the answer sits. Your Centrelink statement carries the subsidised hours line for each child. Your centre’s statement carries what those hours cost and what is left for you to pay. The gap between the two is the number you are looking for, and it is the one nobody else can see.

Two statements, two jobs. The Centrelink statement is the record of what the government pays towards the care; the centre’s statement is the record of what the care costs. Read alone, either one is confusing. Read together, they answer the question the family asked, which is what a week of care costs after the subsidy has done its part.
The statement also has limits. It will not explain why a week’s hours look the way they do, and it will not compare one month with another; it is a record rather than an explanation. If a line looks wrong, that question belongs with Services Australia, and asking it early is easier than reconstructing it at the end of a quarter. The check is also not a challenge to a decision or a way to fix an error; those are conversations with the agency. It is the habit of knowing your own number, which is the thing that turns a policy change into something a household can plan around.
What to check on your statement
This is a three-minute job, and it is best done now rather than in a January queue. Find the most recent statement. Find the subsidised hours line for each child, and check it against the hours your centre charges for. Then write the gap down somewhere you will see it again, because that number is the one your budget is built on. One habit makes the check faster each time: keep last month’s statement with this month’s, so the comparison is a glance rather than a search.
If the hours on the statement look wrong, that is a question for Services Australia rather than for this page, and the same goes for anything about claiming or backdating. What this article can do is get you to the right numbers, and the guarantee means the floor under those numbers is higher than it was. Bring the statement with you when you ask, because the hours line is the number the conversation is about, and if everything on the page is right, the job is done: the number is confirmed, and the budget can use it.
Sources: Department of Education – 3 Day Guarantee – Early Education (fact sheet)

A family in transition needs a base, and the transition has many shapes: a relocation for work, a renovation that has made the house uninhabitable, a hospital stay that puts the family near a treatment centre, or a move towards disability supports. Medium term accommodation is the category of housing that fills the gap between a hotel and a home, and it is chosen differently from either. This article covers what it is, how the funded version differs from the private one, what to confirm before signing, and how to judge a property when someone in the family has mobility needs.
What medium term accommodation is
Medium term accommodation, usually shortened to MTA, is furnished housing let for a period longer than a holiday stay and shorter than a standard residential lease. The practical difference from a hotel is the furniture and the facilities: a kitchen to cook in, laundry, storage, and enough space for a family’s routines to continue rather than pause. The difference from a lease is the flexibility: the agreements are written for a defined period, and the period sits between weeks and several months depending on the arrangement.
That definition is deliberately without a number, and the reason is practical. The length of a stay depends on what the accommodation is for and, where it is funded, on the rules of the funding. The figure to rely on is the one written into the agreement in front of you, and where a funded stay is involved, the one confirmed against the scheme’s current guidance rather than a recollection.
How funded MTA differs from a private rental
Most MTA is simply a private rental on a shorter agreement, and it is booked the way any rental is. Where the accommodation is funded through the National Disability Insurance Scheme, it is a defined support with its own purpose rather than a general housing benefit. The funded version exists for a specific situation: a participant who needs somewhere to live during a transition, such as while a longer-term housing solution is being arranged or a home is being modified, and it is assessed against that need with evidence, like any other support.
The practical consequence for a family is that the funded route has conditions attached, records required, and a defined ending, while the private route is a commercial arrangement with a landlord. Knowing which route a stay sits on decides what to ask, who to ask, and what happens when the period ends. Where the wider support picture is unclear, what home and living support funds sets out how the funded supports around housing are organised.
What to confirm before signing
The agreement is where the trip hazards live, and a short list covers most of them.
- The minimum and maximum stay, in writing, and what happens if the family needs to leave early or stay longer than planned.
- The bond, including what it can be claimed against and when it is returned.
- The notice period, on both sides, because an agreement that only allows the landlord to end it quickly is not the flexibility it appears to be.
- What is furnished and what is not, room by room, since a furnished property that lacks a desk for schoolwork or a second bed for a carer is not furnished for this family.
- Utilities and inclusions: power, water, internet, and any services bundled into the rent.
- Repairs and responsibility: who fixes what, how quickly, and how to report it.
- Accessibility features, in writing, if anyone in the family needs them.
A written list of answers to those questions is worth more than an afternoon of viewing, because the agreement is what will be enforced when the stay is under way.
What it suits, and what it is not
The families that medium term accommodation suits best share a shape: they know roughly how long the transition will last, they need the household to keep running during it, and they are not yet in a position to commit to a standard lease. The accommodation is a base rather than a destination, and the arrangements that work are the ones where the period is defined and the next step is in progress.
Two things it is not are worth stating plainly. It is not emergency or crisis accommodation, which is a separate system with its own access routes and which a family should be pointed to immediately if that is the need. And it is not a long-term housing solution; staying in medium term accommodation beyond its purpose neither serves the family nor survives a review on the funded route. Where a family is unsure which of the systems their situation belongs to, the honest first step is a conversation with the provider, the support coordinator if one is funded, or the relevant housing service, rather than a booking.
Checking a property for mobility needs
Where a family member has mobility needs, the property has to be assessed rather than described. The features that matter are specific, and a viewing or a video walkthrough should confirm each one.
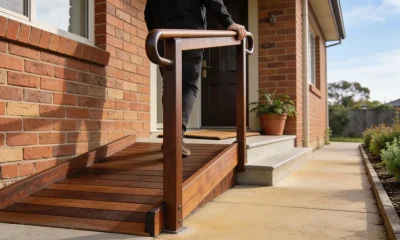
Look for step-free entry, or a ramp that can be added without obstructing the path. Check the bathroom: access to the shower or bath, whether rails are fitted, and whether a shower chair would fit. Check that the internal doorways and hallway allow comfortable passage for the mobility aid in use, and that there is room to turn. Confirm the level the property sits on, and whether a lift serves it. Check the route from the parking or the street, since a property can be accessible and still unreachable with a wheelchair if the approach is not. And ask what changes are permitted, because an owner’s willingness to approve a rail or a ramp matters as much as the space itself.
If a viewing is not possible, ask for photographs and measurements of the specific features, and get the answers in writing before the bond is paid.
What to do when the stay ends
The end of a stay is planned from the start, not discovered at the end. Two habits make it orderly. At move-in, complete a condition report with the provider or landlord, dated and photographed, so the bond return at the end is a comparison rather than an argument. Through the stay, keep the paperwork that the arrangement requires, including receipts and any correspondence about extensions, because a funded stay will be reviewed and a private one may need to evidence its dates.
When the stay ends, return the property in the condition it was received, give the notice the agreement requires, and confirm the bond process in writing. Where the stay was funded and the next step is a supported living arrangement, the transition is easier planned early: what makes a reliable supported living provider covers the checks that family members most often wish they had run sooner.
Choosing well
The choice of accommodation is a decision about a period of a family’s life, and it rewards the same discipline as any tenancy: confirm what the agreement says, match the property to the specific needs in the household, and plan the ending at the start. Get those three things right and the transition is what it should be, which is a place to live while the real plan proceeds.


 Healthcare1 year ago
Supported Independent Living Explained: What SIL Covers and Who It Suits
- Food1 year ago
Balance Your Plate, Boost Your Mood: Beginner’s Guide to Eating Well
- Healthcare1 year ago
Oral Health at Every Age: What Changes and What to Watch For
- Healthcare1 year ago
The Allergy You Can’t See: How to Detect and Manage Silent Food Reactions
- Healthcare1 year ago
Occupational Therapy for Children: The Signs It Could Help, and How to Start
- Healthcare1 year ago
Home and Living Support Under the NDIS: What It Funds and How It Fits a Plan
- Business1 year ago
Connections That Count: Why Networking Is Still Crucial for Business Success
- Healthcare1 year ago
When Everyday Tasks Get Hard: What an Occupational Therapist Can Do